Sterling Market Commentary for Thursday January 24th, 2013

Sterling Market Commentary for Thursday January 24th, 2013

A Look at Wednesday’s Market:  The overall market moved moderately higher in a relatively broad based move that saw the majority of the various sector indices I track move higher on the day as well.  In the commodities markets,  Oil was lower by $1.45 to $95.23 per barrel, and Gold was lower by $6.50 to $1,686.70 per ounce.  In the grain markets,  Wheat was lower by $0.044 to $7.7746 per bushel, and Corn was by $0.076 to $7.206 per bushel, while Soybeans were lower by $0.146 to $14.370 per bushel.

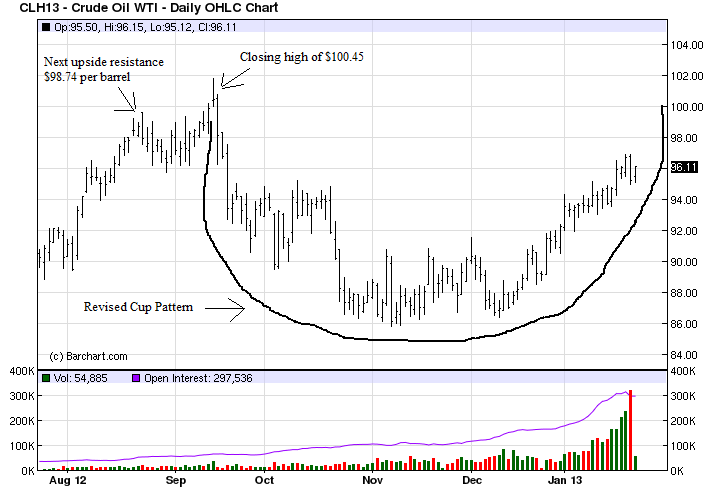
A Few Thoughts on Thursday’s Market:  In looking at the charts from yesterday’s market activity, what caught my eye was the price of oil which closed at $95.23 per barrel.  In the Thursday’s January 10th edition of the Sterling Market Commentary I wrote about the price of Oil testing $94.74 per barrel.  The price of Oil closed above that level on Wednesday January 14th.  Since then, the price of oil has remained above $94.74 for over a week now.  I thought today would be a good time to take an updated look at the chart of Oil which I have inserted below for your review.

March Oil Futures Contract showing updated resistance levels and Cup Pattern Forming

Oil Futures Contract Showing Updated Resistance Levels

What I see in the chart is the price of oil continuing to move higher and test the next upside resistance level at $98.74 per barrel which was set on August 22nd.  If the price of Oil can close above that price level, then I see it continuing to move higher and test $100.45 per barrel, the closing high for the March contract which was set in mid September of last year.  I have taken the rare step of revising my projections on the cup pattern being formed in the oil market.  Here are my new projection.  If the price of Oil closes above $100.45 per barrel, then it will have completed a cup pattern with a measured move to $114.82 per barrel.  I think that this is significant not only from a trading standpoint, but in that I believe it will have a negative impact on the economy; ultimately hurting economic growth.

The Bottom Line:  I am expecting the overall market to continue to move higher.

Follow us on Twitter under sterlinginv and get our intra-day comments on the market.

www.sterlinginvestments.com

Sterling Market Commentary for Tuesday January 22nd, 2013

Sterling Market Commentary for Tuesday January 22nd, 2013

A Look at Friday’s Market:  The overall market moved moderately higher on Friday in a relatively broad based move that saw the majority of the various sector indices I track move higher on the day as well.  In the commodities markets,  Oil was higher by $0.10 to $96.04 per barrel, and Gold was lower by $3.80 to $1,6870.00 per ounce.  In the grain markets,  Wheat was higher by $0.100 to $7.912 per bushel, and Corn was higher by $0.030 to $7.274 per bushel, while Soybeans were lower by $0.010 to $14.292 per bushel.

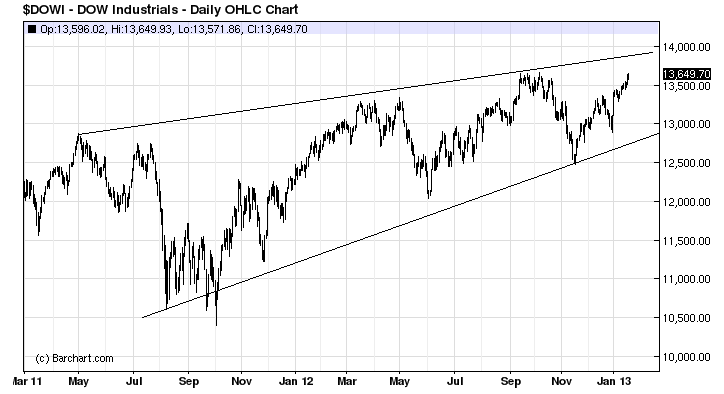
A Few Thoughts on Tuesday’s Market:  In the last couple editions of the Sterling Market Commentary I have been writing about the Dow Jones Industrial Average and my thoughts for it moving higher.  With the Dow Jones Industrial Average having recently completed a cup pattern, as discussed in the Thursday January 17th edition I talked about a cup pattern being completed and it producing a measured move to 14,667.92 with a rough estimate of 9 to 15 months to reach that target level.  In the Friday January 18th edition I took a look at short term trendlines that I thought would come into play around 13,700.  Obviously that is a little short of my target of 14,667 on the Dow.  In today’s edition of the Sterling Market Commentary I wanted to take a look at the longer term trendlines and see if we could get some further clarification.  I have inserted a longer term chart of the Dow Jones Industrial Average below for your review.


Dow Jones Industrial Average Longer Term Chart through January 18th, 2013

Dow Jones Industrial Average Longer Term Chart through January 18th, 2013

In looking at the chart of the Dow Jones Industrial Average, the chart shows that we are looking at longer term trendlines that indicate that we will probably see short term upside resistance around 13,900 level; after which we should see a pullback of sorts before the Dow resumes it move towards higher levels.  What I see as somewhat disturbing on both charts is that the lower, supporting trendline is steepening at a faster pace.  This indicates that we are seeing a narrowing of the trading range, and that we are approaching a period where it will break either sharply higher or lower.  My concern is that given the debt level of this country, we will see a sharp break to the upside.

The Bottom Line:  I continue to see the market tracking sideways with an upward bias.


Sterling Market Commentary for Friday January 18th, 2013

Sterling Market Commentary for Friday January 18th, 2013

A Look at Thursday’s Market:  The overall market moved solidly higher yesterday in a broad based move that saw the majority of the various sector indices I track move higher on the day as well.  In the commodities markets, Oil was higher by $1.26 to $95.94 per barrel, and Gold was higher by $7.60 to $1,690.80 per ounce.  In the grain markets,  Wheat was lower by $0.036 to $7.812 per bushel, and Corn was lower by $0.066 to $7.244 per bushel, while Soybeans were lower by $0.062 to $14.302 per bushel.

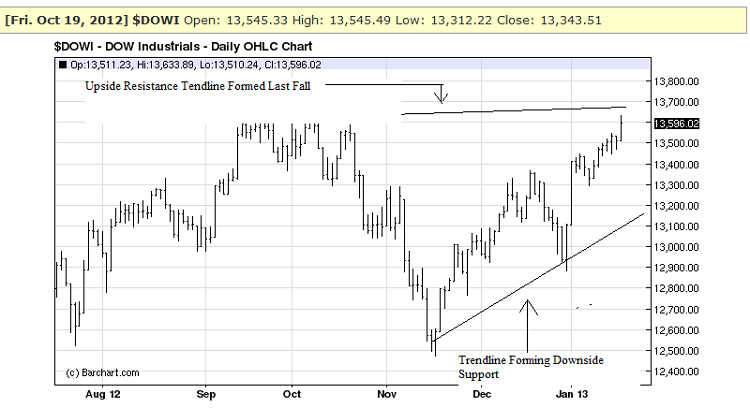
A Few Thoughts on Friday’s Market:  In looking at yesterday’s market, the Dow Jones Industrial Average closed higher by 84.79 point at 13,596.02  In yesterday’s edition of the Sterling Market Commentary I discussed my thoughts on the Dow Jones Industrial Average completing a cup pattern with a measured move to higher levels.  I thought that today would be a good day to take a look at previous resistance encountered when the Dow Jones Industrial Average has reached these levels in the past.  In doing my review I looked at 2 charts of the Dow Jones Industrial Average; the 1st being a short term chart and the 2nd being a longer term 2 year chart.  I’ve inserted the short term chart below for your review and I will discuss the longer term chart in next Tuesday’s edition of the Sterling Market Commentary.

Dow Jones Industrial Average through January 17th, 2013

Dow Jones Industrial Average through January 17th, 2013

What we see on the chart of the Dow Jones Industrial Average that I posted above is an upward trendline that originated last fall when the Dow Jones Industrial Average previously reached these levels.  We can see that it is upward sloping, but indicates that resistance comes back into play just below 13,700.  The chart also shows a steeply upward sloping downward support line.  Extending both of those trendlines out further than I actually had room for on the chart, would show that they are forming a triangle pattern with an ever tightening trading range.  As I have written about many times in the past,  these triangle patterns almost always signal an upcoming break one way or another.  In this case the Dow Jones Industrial Average will break either very sharply to the upside or to the downside.  I think we will probably see clarification on this over the course of the next 1-2 weeks.

The Bottom Line:  I continue to expect the market to drift sideways with an upside bias.

www.sterlinginvestments.com


Sterling Market Commentary for Thursday January 17th, 2013

Sterling Market Commentary for Thursday January 17th, 2013

A Look at Wednesday’s Market:  The overall market finished Wednesday mixed with the major market indices mixed as well.  The Dow Jones Industrial Average was slightly lower while the S&P 500 and Dow Jones Industrial Average were slightly higher.  In the commodities markets,  oil was higher b $94.68 per barrel, and Gold was lower by $0.70 to $1,683.20 per ounce.  In the grain markets,  Wheat was higher by $0.022 to $7.850 per bushel, and Corn was higher by $0.060 to $7.312 per bushel, while Soybeans were higher by $0.23 to $14.364 per bushel.

A Few Thoughts on Thursday’s Market:  I have very grave concerns about the situation in Washington DC., and what I view as a very strong possibility that the negotiations over the raising of the debt ceiling for the Federal Government will not go well and will result in a very negative situation for the U.S. Economy and the U.S. stock market.  However, I have to admit that the overall trend of the market is currently to the upside.  In Tuesday’s edition of the Sterling Market Commentary  I looked at the Dow Jones Transportation Average, and what I thought the measured move to higher levels would be if the Dow Transports completed a cup pattern that was being formed.  In order to complete the cup pattern the Dow Jones Transportation Average needed to closed above 5,618.  Well on the Dow Jones Transportation Average has closed above that level the last two (2) trading days.

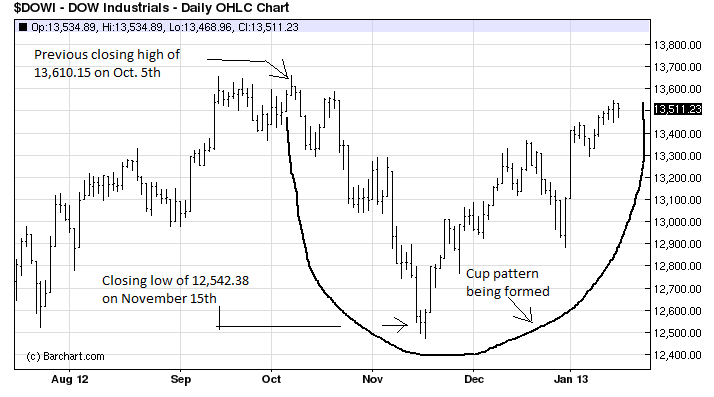
Since I am a believer in Dow Theory, which essentially states that any sustained move higher by the Dow Jones Industrial Average will be confirmed by a move higher in the Dow Jones Transportation Average, I thought now would be a good time to take a closer look at the Dow Jones Industrial Average.  I have inserted a chart of the Dow Jones Industrial Average below for your review.


Dow Jones Industrial Average though January 16th, 2013

Dow Jones Industrial Average though January 16th, 2013

As you can see the Dow Jones set a closing high of 13,610.15 on October 5th of last year and then declined to a low of 12,542.38 on November 15th before rallying back to its current levels.  Yesterday the Dow Jones Industrial Average closed at 13,511.23.  If the Dow Jones Industrial Average can move an 100 points or so higher and close above 13,610.15 then it will have completed a cup pattern with a measured move to 14,677.92  It is always difficult to forecast the amount of time it would take for the Dow Jones Industrial Average to reach the 14,600 level.  However, based upon my past experience, I would estimate that it would be somewhere between 9 and 15 months.

I should point out that until the Dow Jones Industrial Average closes above 13,610.15 the cup pattern is not completed, and there should not be any expectations for the Dow Jones Industrial Average reaching the 14,600 level.  Additionally there is always the chance that the Dow Jones Industrial Average has entered an area of resistance that it cannot break through, and as a result the Dow Jones Industrial Average may turn back lower.  All it would take for this to happen is some bad earnings announcements or more negative news out of Washington, Europe, or China.

The Bottom Line:  I am expecting the overall market to continue to drift sideways with a slight upward bias.

www.sterlinginvestments.com


Sterling Market Commentary for Tuesday January 15th, 2013

Sterling Market Commentary for Tuesday January 15th, 2013

A Look at Monday’s Market:  The overall market moved moderately higher in a relatively broad based move that saw the majority of the various sector indices I track move higher on the day as well.  In the commodities markets, Oil was higher by $0.58 to $94.14 per barrel, and Gold was higher by $8.80 to $1,669.40 per ounce.  In the grain markets, Wheat was higher by $0.122 to $7.670 per bushel, and Corn was higher by $0.152 to $7.240 per bushel,  while Soybeans were higher by $0.446 to $14.180 per bushel.

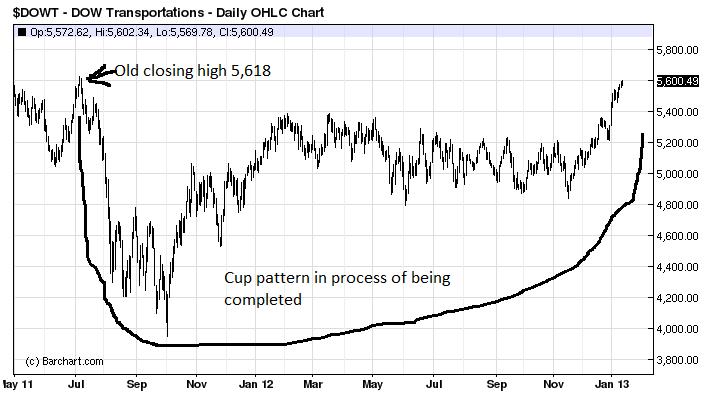
A Few Thoughts on Tuesday’s Market:  In reviewing the charts from yesterday’s trading activity, the chart of the Dow Jones Transportation Average caught my eye.  The Dow Jones Transportation Average closed yesterday at approximately 5,600.  The Dow Jones Transportation Average has quietly set a new yearly high over the course of the last couple of weeks.  It now appears to be within a few points of completing a longer term cup pattern, which upon completion would signal a move significantly higher by the Dow Jones Transportation Average.  I have included a chart of the Dow Transports below for your review.

Dow Jones Transportation Average

Dow Jones Transportation Average through January 14th, 2013

The Dow Jones Transportation Average set a closing high of approximately 5,618.25 back on July 7th of 2011, and reached a closing low of 4,038.73 on October 3rd of 2011.  If the Dow Jones Transportation Average closes above 5,618.25 it will have completed a cup pattern with a long term measured move to approximately 7,197.77  While I am not predicting this to be a fast move,  the strength in the Dow Jones Transportation Average is significant if you believe in the Dow Theory, which basically states that any sustained move higher by the Dow Jones Industrial Average will need to be confirmed by the Dow Jones Transportation Average.

My thoughts are that the current move higher by the Dow Jones Industrial Average is being confirmed by the Dow Jones Transportation Average, and as a result we may see the overall market push new highs at some point this year.  However, I continue to see a great deal of political risk to the market.  I think there is a very good chance that the negotiations to raise the Federal debt ceiling are going to turn into a bare knuckled fight that is guaranteed to leave at least one side bloodied.  If this happens, any thoughts of the market setting significant new highs in the near future may be off the table for quite some period of time.

The Bottom Line:  I am expecting the overall market to track sideways with a slight upwards bias over the course of the next several trading sessions.

www.sterlinginvestments.com


Sterling Market Commentary for Friday January 11th, 2013

Sterling Market Commentary for Friday January 11th, 2013

A Look at Thursday’s Market:  The overall market moved moderately higher in a broad based move that saw the majority of the various indices I track move higher on the day as well.  In the commodities markets, Oil was higher by $0.72 to $93.82 per barrel, and Gold was higher by $22.50 to $1,678.00 per ounce.  In the grain market, Wheat was lower by $0.010 to $7.444 per bushel, while Corn was higher by $0.044 to $6.986 per bushel, and Soybeans were lower by $0.056 to $13.796 per bushel.

A Few Thoughts on Friday’s Market:  In looking at the charts of the major market indices, I would like to remind everyone that the Dow Jones Industrial Average is entering an area of upside resistance where significant or meaningful gains from these price levels may be very difficult to achieve.  I continue to see significant political risk to the market that could easily send the market dramatically lower in a very quick period of time.  As a result we are recommending that investors tighten their stops,  consider selling calls on any stock that may be approaching over bought territory, and in some cases buy puts outright.

Sterling Investment Services primarily produces three (3) publications. We publish the Sterling Market Commentary Blog, the Sterling Weekly, and Custom Small Cap Research.  Additionally, you can now follow us on Twitter under sterlinginv and get our intra-day comments on the market. Sign up now to follow us and get our thoughts and comments as the market moves!
www.sterlinginvestments.com