
Sterling Market Commentary for Friday January 18th, 2013
A Look at Thursday’s Market: The overall market moved solidly higher yesterday in a broad based move that saw the majority of the various sector indices I track move higher on the day as well. In the commodities markets, Oil was higher by $1.26 to $95.94 per barrel, and Gold was higher by $7.60 to $1,690.80 per ounce. In the grain markets, Wheat was lower by $0.036 to $7.812 per bushel, and Corn was lower by $0.066 to $7.244 per bushel, while Soybeans were lower by $0.062 to $14.302 per bushel.
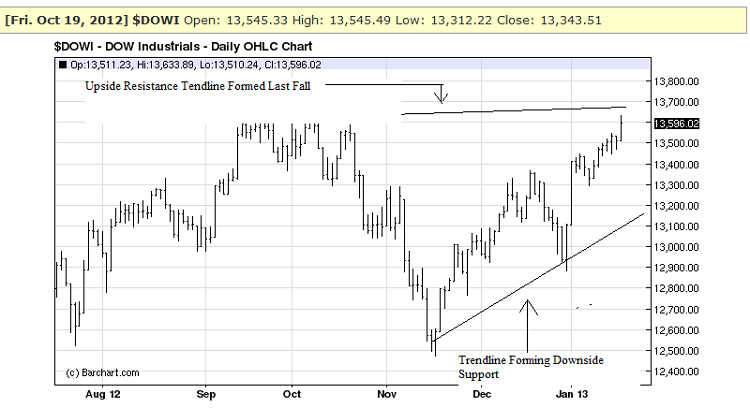
A Few Thoughts on Friday’s Market: In looking at yesterday’s market, the Dow Jones Industrial Average closed higher by 84.79 point at 13,596.02 In yesterday’s edition of the Sterling Market Commentary I discussed my thoughts on the Dow Jones Industrial Average completing a cup pattern with a measured move to higher levels. I thought that today would be a good day to take a look at previous resistance encountered when the Dow Jones Industrial Average has reached these levels in the past. In doing my review I looked at 2 charts of the Dow Jones Industrial Average; the 1st being a short term chart and the 2nd being a longer term 2 year chart. I’ve inserted the short term chart below for your review and I will discuss the longer term chart in next Tuesday’s edition of the Sterling Market Commentary.
- Dow Jones Industrial Average through January 17th, 2013
What we see on the chart of the Dow Jones Industrial Average that I posted above is an upward trendline that originated last fall when the Dow Jones Industrial Average previously reached these levels. We can see that it is upward sloping, but indicates that resistance comes back into play just below 13,700. The chart also shows a steeply upward sloping downward support line. Extending both of those trendlines out further than I actually had room for on the chart, would show that they are forming a triangle pattern with an ever tightening trading range. As I have written about many times in the past, these triangle patterns almost always signal an upcoming break one way or another. In this case the Dow Jones Industrial Average will break either very sharply to the upside or to the downside. I think we will probably see clarification on this over the course of the next 1-2 weeks.
The Bottom Line: I continue to expect the market to drift sideways with an upside bias.