
Sterling Market Commentary for Tuesday January 22nd, 2013
A Look at Friday’s Market: The overall market moved moderately higher on Friday in a relatively broad based move that saw the majority of the various sector indices I track move higher on the day as well. In the commodities markets, Oil was higher by $0.10 to $96.04 per barrel, and Gold was lower by $3.80 to $1,6870.00 per ounce. In the grain markets, Wheat was higher by $0.100 to $7.912 per bushel, and Corn was higher by $0.030 to $7.274 per bushel, while Soybeans were lower by $0.010 to $14.292 per bushel.
A Few Thoughts on Tuesday’s Market: In the last couple editions of the Sterling Market Commentary I have been writing about the Dow Jones Industrial Average and my thoughts for it moving higher. With the Dow Jones Industrial Average having recently completed a cup pattern, as discussed in the Thursday January 17th edition I talked about a cup pattern being completed and it producing a measured move to 14,667.92 with a rough estimate of 9 to 15 months to reach that target level. In the Friday January 18th edition I took a look at short term trendlines that I thought would come into play around 13,700. Obviously that is a little short of my target of 14,667 on the Dow. In today’s edition of the Sterling Market Commentary I wanted to take a look at the longer term trendlines and see if we could get some further clarification. I have inserted a longer term chart of the Dow Jones Industrial Average below for your review.
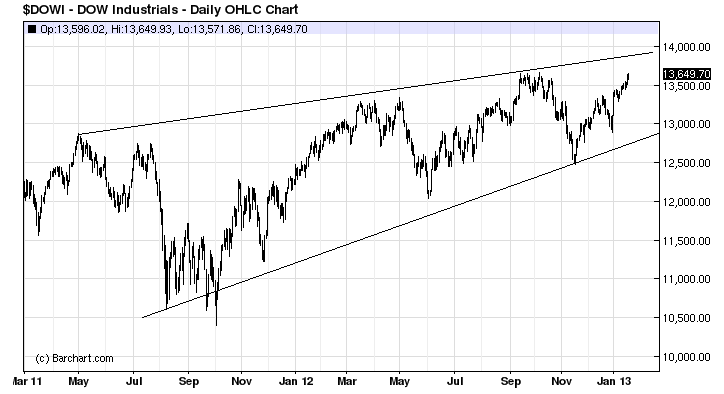
In looking at the chart of the Dow Jones Industrial Average, the chart shows that we are looking at longer term trendlines that indicate that we will probably see short term upside resistance around 13,900 level; after which we should see a pullback of sorts before the Dow resumes it move towards higher levels. What I see as somewhat disturbing on both charts is that the lower, supporting trendline is steepening at a faster pace. This indicates that we are seeing a narrowing of the trading range, and that we are approaching a period where it will break either sharply higher or lower. My concern is that given the debt level of this country, we will see a sharp break to the upside.
The Bottom Line: I continue to see the market tracking sideways with an upward bias.