Sterling Market Commentary for October 17th, 2011

A Look at Friday’s Market:  The overall market moved sharply higher on Friday in a broad based move that saw every sector I track moved higher with the exception of the airline indices.  The strongest sectors were the Oil Services,  Oil & Gas, Gold/Silver, Commodities, Natural Gas, Transports, Cyclicals, Chemicals, and High Tech indices.  The Dow Jones Industrial Average was higher by 1633 points.  In the Dow the top performers were Caterpillar, DuPont, Disney & Co., Chevron, and General Electric.  Oil was higher by $2.55 to $87.00 per barrel, and Gold was higher by $14.50 to $1,683.00 per ounce.  In the grain market,  Wheat was higher by $046 to $6.226 per bushel,  and Corn was higher by $0.016 to $6.40 per bushel, while Soybeans were higher by $0.130 to $12.70 per bushel.

A Few Thoughts Before the Open:  In looking at the charts from Friday’s market activity I have the following thoughts and comments.

1.  Volume was very light across the board. On an average morning I review the charts on approximately 40 indexes,  all the stocks setting new yearly highs, and all stocks that traded more than 1 million shares the day before. In looking at the charts from Friday’s activity,  I saw nothing that broke out to the upside that had a volume confirmation.  That alone should be a warning bell for the upcoming market.

2.  In looking at the Dow Jones Industrial Average it is interesting to note that Friday’s close appears to have been pretty much right on the 200 day moving average. I have the Dow closing at 11,644.49 and the 200 day moving average at 11,656.29

3.  It does look like many of the sector indices I track have broken out to the upside despite their low volume.  As a result, I am updating the support and resistance levels on the indexes I’ve been tracking.

4.  It’s earnings season, and the results of any one of a key group of companies can swing the market.

In looking at the major market indices I track, I have the following updates on support and resistance:

Dow Jones Industrial Average:  The Dow Jones Industrials closed at 11,644.49  I now see upside resistance on the Dow at 11,896.44 and downside support at 10,415.54 on a closing basis.   The light volume the last 1-2 weeks on the Dow Jones Industrial Average makes me nervous and I am not convinced this rally has legs beyond the current levels.  I hate to sound like a broken record,  but my gut continues to tell me to be cautious until I get the confirmation the market historically requires.

S&P 500 ‘SPX’:  The S&P 500 closed at 1,224.58  I see upside resistance on the S&P 500 at 1,256.88 and downside support at 1,096.48 on a closing basis.  I expect I’ll be able to tighten the trading range on the S&P 500 within the next few days.

NASDAQ 100 Index ‘NDX’:  The NASDAQ 100 closed at 2,371.94  I now see upside resistance on the NDX at 2,429.45 and downside support at 2,192.96 It should be noted that the NASDAQ 100 ‘NDX’ is a capitalization weighted index  and the recent massive outperformance of the NASDAQ 100 ‘NDX’ in comparison to the Dow Jones Industrial Average and the S&P 500 is a function of the excessive weighting Apple ‘AAPL’ and the structural flaws of the NASDAQ 100.

The Dow Jones Transportation Average:  The Dow Transports closed at 4,691.46    I now see upside resistance on the Dow Transports at 4,950.00 and downside support level  at 4,038.73 on a closing basis.  Again,  very light volume on this index makes me skeptical of the recent rally.


Sterling Market Commentary for October 14th, 2011

The overall market was rather dull yesterday.  It reminds me of an old saying about never shorting a dull market.  It looks like we may be seeing a rally in the high tech sector as many of the high tech indices put in good performances yesterday.  However while it is very tempting to declare the start of a market rally, which may be the case; I continue to stand by convictions that we need to see a close above 11,613.53 on the Dow Jones Industrial Average in order to confirm a breakout from the sideways pattern we’ve been in since mid-August.

In looking at the commodities markets,  Oil was lower by $1.34 to $84.23 per barrel, and Gold was lower by $14.10 to $1,668.50 per ounce.  In the Grain markets Wheat was lower by $0.086 to $6.18 per bushel, and Corn was lower by $0.024 to $6.382 per bushel, while Soybeans were higher by $0.174 to $12.57 per bushel.

The Bottom Line:  I expect the situation on the market to clarify itself within the next few days.

Sterling Market Commentary for October 13th, 2011

It’s been a few days since my last post as I’ve been out of the office on a few projects and just not available prior to the open.  Since then the overall market has put in a strong rally.  The Dow Jones Industrial Average has risen from a closing low of 10,655.30 to close at 11,518.85 yesterday for a gain of 863.55 points or approximately 8.1%.  As of yesterday’s close, the Dow Jones Industrial Average is now down only 1.39% on the year.  While my 1st Rule a Trend may be that a trend remains in place until it is broken;  my 2nd Rule of Trends is that the longer a trend remains in place the greater the chance it will be broken.

While the Dow has clearly broken above the triangle pattern shown in the chart posted in Monday’s blog, it should also be noted that it had also broken below support a few times as well.  As always,  the question remains what is the direction of the market?

Well, since the market sold off in early August,  the post selloff closing high on the Dow Jones Industrial Average is 11,613.53 This is about 95 points below yesterday’s close.  I always consider my role to be one that interprets what the market is telling me,  not someone who tries to bend his forecast to fit some underlying wishes or desires.  While it is very tempting to declare a new market rally to the highs set earlier this year;  I am going to maintain my opinion that the market is in a sideways pattern until we see the Dow Jones Industrial Average close above 11,613.53 on meaningful closing basis.

The Bottom Line:  I am still looking for the market to track sideways and have doubts about the strength of the recent rally.

Sterling Market Commentary for October 10th, 2011

A Look at Friday’s Activity:  The overall market finished Friday slightly lower with the Dow Jones Industrial Average lower by approximately 20 points.  The broad market was mostly to the downside with a majority of the sector indices I track lower on the day.  There was strength in the Utilities,  Semiconductors, and the Retailers.  The weakest sectors were Banking, Broker/Dealers, Biotech, Insurance, Gold/Silver, Airlines, Commodities,  High Tech, Natural Gas, Oil Services, and Transports.

Oil was higher by $0.39 to $82.98 per barrel, and Gold was lower by $17.40 to $1,635.80 per ounce.  In the Grain markets,  Wheat was lower by $0.084 to $6.074 per bushel, and Corn was lower by $0.054 to $6.00 per bushel, while Soybeans were lower by $0.054 to $11.582 per bushel.

A Few Thoughts Before the Open:  In looking at the charts from Friday’s activity I have the following thoughts.

1.  The pre-market futures are sharply higher this morning due to the news out of Europe that Germany and France have pledged to come to a solution for the European debt crisis within the next 2 weeks.  This makes me nervous.  They have not actually agreed upon a solution.  Additionally deadlines to come to agreement typically produce bad agreements in my opinion.  I have said it before,  and I’ll say it again;  Europe has deep structural problems with its entitlement system that are generational in nature and will take years, if not decades to fix, if at all.

2.  In looking at the charts of the various sector indices I track,  there just doesn’t seem to be any that are really signaling a rally has started.  Perhaps that will change following today’s activity.

3.  The vast majority of the stocks I looked at still appear to be tracking sideways. The only real improvement is that the number of stocks that have bullish patterns is about equal to those with bearish pattern;  but the overall number of both is still a very small number.

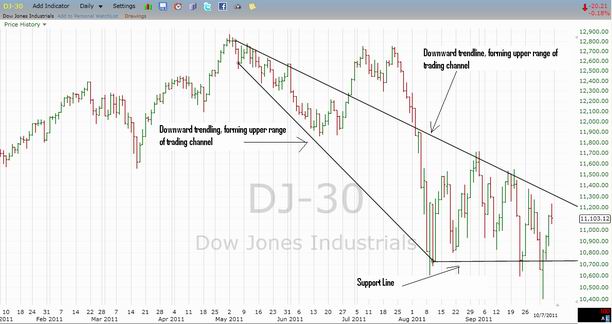
4.  In looking at a chart of the Dow Jones Industrial Average, which I have inserted below,  I see a pair of downward trendline intersecting with a support line at the 10,700 level.  The chart shows that the Dow Jones Industrial Average has been tracking sideways since early August and in doing so has been working itself into a tighter trading range.  In my opinion this forms what I call a “triangle pattern” with a highly predictable outcome.  There is a high degree or probability as the downward trendline that is forming the upper range of the trading channel gets closer to the downward support line the overall market will make a big move to either the upside or the downside.  Experience has taught me that we will most likely see this occur within the 1st couple of weeks of November.  I do not honestly whether the breakout will be to the upside or the downside,  my gut is telling me that there is a good chance it could be to the downside; but only time will tell and perhaps things will clarify themselves in the next couple of weeks.

Dow Jones Industrial Average with Triangle Pattern

Dow Jones Industrial Average - October 7th, 2011

I hope to get a chance to update our support and resistance level on the various indices I track in tomorrow morning’s blog.

www.sterlinginvestments.com

Sterling Market Commentary for October 5th, 2011

A Look at Tuesday’s Market Activity:  The overall market staged a very impressive rally in the last hour of the day with the Dow Jones Industrial Average rallying almost 300 point in 45 minutes.  While it is not entirely clear what sparked this rally,  the media is giving credit to comments from Europe about their realization that they need to protect their banks from failure.  If this is the case,  then  I consider it be nothing more than than a case of computer driven momentum activity.  I help edit the Sterling Reporter, and this so called news, was basically reported on very early in the morning by the UK newspapers.  Unfortunately I think this volatility is pretty much the new normal,  we are going to need to learn how to deal with this volatility and ride it out.

Oil was lower by $1.94 to $75.67 per barrel, and Gold was lower by $41.70 to $1,616.00 per ounce.  In the grain markets, Wheat was lower by $0.154 to $6.04 per bushel, and Corn was lower by $0.046 to $5.876 per bushel, while Soybeans were lower by $0.174 to $11.60 per bushel.

A Few Thoughts Before the Open:  In looking at the charts from yesterday’s trading activity I have the following comments.

1.  Despite yesterday’s strong rally,  the Dow Jones Industrial Average closed below 9-Day moving average and still has a bearish chart pattern.  If anything, I see yesterday’s move lower as testing the weakness of support at the 10,400 level.

2.  I continue to maintain that the overall market is in a sideways pattern with a downward bias.

The Bottom Line:  Until I see a close above our stated upside resistance levels I do not see any indication of a sustainable market rally.

Sterling Market Commentary for October 4th, 2011

A Look at Monday’s Market Activity:  The overall market sold off sharply yesterday in a broad based move that saw every sector index I track move lower on the day.  The weakest sectors of the market were the Airlines, Broker/Dealers, Banking, High Tech, Biotech, Commodities, Oil Services, Natural Gas, Transports, Cyclicals, Oil & Gas, Insurance,  and Commodities related indices.  The Dow Jones Industrial Average was lower by 258 points.  Among the Dow components,  Bank of America ‘BAC’ was down almost 10%, followed by Alcoa ‘AA’ with a 7% decline, and Caterpillar with a 4.7% decline.  The only Dow component to finish the day higher was Wal-Mart ‘WMT’ which posted a whopping $0.06 per share gain on the day.  Oil was lower by $1.59 to $77.61 per barrel, and Gold was higher by $4.90 to $1,620.40 per ounce.  In the Grain markets, Wheat was higher by $0.102 to $6.194 per bushel, and Corn was unchanged at $5.924 per bushel, while Soybeans were lower by $0.014 to $11.774 per bushel.

A Few Thoughts Before the Open:  In looking at the charts from yesterday’s trading activity I noticed the following:

1.  The Dow Jones Industrial Average closed down 258.07 points at 10,665.30  In the process the Dow Jones Industrial Average broker support at 10,719.94  In looking at a chart of the Dow,  which I have posted below,  it looks like the Dow has a converging triangle pattern forming.  These patterns are typically very predictable.  The index or stock in such a pattern will generally consolidate as it moves towards the corner of the pattern and then brake sharply in one direction or another.  In the case of the Dow chart below, it may take a couple of days to determine in this is the break or not, I think it is and it is a break to the downside.  Time will tell, but I see nothing to indicate a move higher.  Additionally with the Dow breaking support at 10,719.94 our next level of support on the Dow is at 10,415.54  If that level fails to hold then we are looking support at the post “Flash Crash” levels of 9,686.48 on a closing basis.

2.  A long time friend of mine, who is a stock broker I have a great deal of respect for, called yesterday and asked about the market.  Our conversation focused on the Dow Jones Industrial Average which I consider to be the leader which all other sectors follow.  Our discussion centered on downside support for the Dow.  I stated that I saw support and 10,415.54 and then at 9,686.48 basically the post “Flash Crash” support levels.  When asked what happens if we break support at 9,6848.48;  I looked at the chart during the spring of 2009 and came up with the following support levels.  I see some reasonably solid downside support in 8,700 range, a little bit at the 8,000 level; and then its a sharp drop to 6,600 on the Dow.  Does this mean I think the Dow is definitely headed towards 6,600?  No.  But I do not see support with any real solidity until the 8,700 level on the Dow.  Does this mean I think the Dow could go to 8,700?  Yes,  I think there is a good chance we could see 8,700 on the Dow Jones Industrial Average by the end of this year.

In looking at the indices I track, I have the following updates on support and resistance:

Dow Jones Industrial Average:  The Dow Jones Industrials closed at 10,655.30  I currently see upside resistance on the Dow at 10,719.94 and downside support at 10,415.54 on a closing basis.    If support fails to hold at 10,415.54 and then I see the next level of support coming in at 9,684.48 on a closing basis.

S&P 500 ‘SPX’:  The S&P 500 closed at 1,099.23  I see upside resistance on the S&P 500 at 1,127.79 and downside support at 1,096.48 on a closing basis.  If support fails to hold at that level, then I see the next level of support coming into play at 1,064.59

NASDAQ 100 Index ‘NDX’:  The NASDAQ 100 closed at 2,085.04  I now see upside resistance on the NDX at 2,192.96 and downside support at 2,038.22 I see the NASDAQ 100 continuing to move lower and testing support at 2,038.22 on a closing basis.  If support fails to hold at that level, then I see the next point of downside support beingat 1,975.33 on a closing basis.

The Dow Jones Transportation Average:  The Dow Transports closed at 4,038.73    I now see upside resistance on the Dow Transports at 4,082.51 and downside support level  at 3,906.23 on a closing basis.

M.S. Commodities Related Equity Index ‘CRX’:  The Morgan Stanley Commodities Related Index ‘CRX’ closed at 735.98.   I now see upside resistance on the ‘CRX’ at 824.91 and downside support at 684.90

S&P Banking Index ‘BIX’:  The ‘BIX’ closed 113.16.  I see upside resistance on the ‘BIX’ at 120.71 and downside support at 100.96 on a closing basis.

Amex Broker/Dealer Index ‘XBD’:  The ‘XBD’ closed at 75.95   I see upside resistance at 80.87 and downside support at 80.87 on a closing basis. I am expecting the ‘XBD” to continue to move lower and test 63.48  on a closing basis.

S&P Insurance Index ‘IUX’:  The ‘IUX’ closed at 147.73 I see upside resistance on the ‘IUX’ at 175.13 and downside support at 143.80 on a closing basis.  I am currently expecting the ‘IUX’ to continue to move lower and test 143.80 on a closing basis. If the S&P Insurance Index ‘IUX’ closes below 143.80, then I expect the ‘IUX’ to continue to move lower and test 120.07 on a closing basis.

Amex Gold & Silver Index:  The Amex Gold & Silver Index ‘XAU’ closed at 182.98  I see upside resistance on the ‘XAU’ at 208.47 and downside support at 177.39

Amex Oil & Gas Index:  The Amex Oil & Gas Index closed at 995.22   I currently see upside resistance on the ‘XOI’ at 1,029.20 on a closing basis and downside support at 977.58.

M.S. Cyclicals Index:  The M.S. Cyclicals Index ‘CYC’ closed yesterday at 737.63  I currently see upside resistance on the ‘CYC’ at 789.46 and downside support at 710.93  on a closing basis.

M.S. Consumer Index:  The M.S. Consumer Index ‘CMR’ closed at 671.20  I currently see upside resistance on the ‘CMR’ at 691.44. and downside support at 657.87 on a closing basis.

www.sterlinginvestments.com