Sterling Market Commentary for Friday November 23rd, 2012
A Look at Wednesday’s Market: The overall market moved moderately higher in a relatively broad based move that saw the vast majority of the sectors I track move higher on the day. Overall it was a relatively lackluster day with light volume as it appears most people were getting an early start on the Thanksgiving holiday. In the commodities markets, Oil was higher by $0.63 to $87.38 per barrel, and Gold was higher by $4.60 to $1,728.20 per ounce. In the grain markets, Wheat was higher by $0.032 to $8.450 per bushel, and Corn was higher by $0.044 to $7.432 per bushel, while Soybeans were higher by $0.180 to $14.126 per bushel.
A Few Thoughts on Friday’s Market: Today’s trading session is a shortened, half day of trading. I am not really expecting much to happen today. I think the market will get back to business next week. At that point in time I would not be surprised to see the market resume its downward trend.
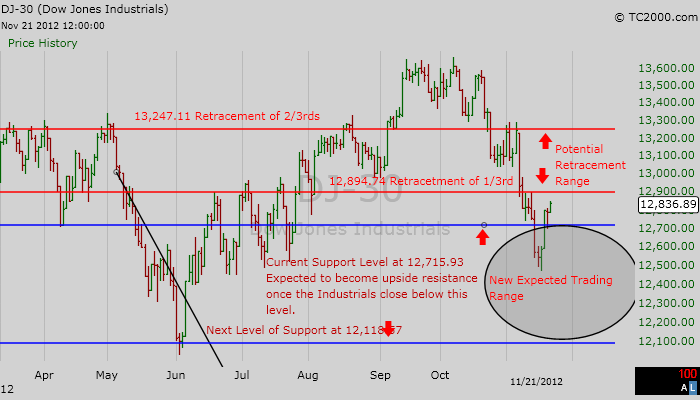
The Dow Jones Industrial Average: The Dow Jones Industrial Average closed at 12,836.89 With the change over to decimalization of quotes and the increased use of computerized trading, support and resistance levels are not always as solid as they used to be. As a result they can be temporarily violated for a day or so before regaining their importance. Despite the fact that the Dow Jones Industrial Average closed above my upside resistance level 3 trading days ago, I am going to maintain my current upside resistance level on the Dow Jones Industrial Average for an another day or so to see if it the Dow moves back below it or not, and if I need to raise it or not. I still see upside resistance on the Dow Jones Industrial Average at 12,715.93 on a closing basis. I now see downside support coming in at 12,118.57 on a closing basis. Current Expectations: I think we are starting a new trend lower in the Dow. I am expecting the Dow Jones Industrial Average to continue to move lower and test 12,118.57 on a closing basis.
With the rally in the market the last few trading sessions one of the key things I have been working on identifying is whether the overall market is starting a new upward trend, if this is a standard retracement, or is it just a bump in the road. Long term readers of my newsletters and blog will know that I consider a retracement to counter move of a longer term movement that is between 1/3rd and 2/3rds of the previous movement. If the move fails to reach the 1/3rd mark, then it is not a retracement, if the move exceeds the 2/3rds market, then it is the start of a new longer trend. The Dow Jones Industrial Average has declined from a high of 13,610.15 to a low of 12,542.38 This is a decline of 1,067.77 points, 1/3rd of the decline is 352.36 points and 2/3rds is 704.73 points. That means for the Dow Jones Industrial to reach retracement range it will need to rally between 352.36 to 704.73 points from its low point of 12,542.38 That would put the retracement range on the Dow Jones Industrial Average between 12,894.74 on the low side and 13,247.11 on the high side. I have inserted a chart below for your review.

Anything less than this is just a bump in the road on a larger move lower. Anything greater than this signals a new rally and a possible testing of the market highs set earlier this year. However it should be noted that a move into retracement range, followed by a move back lower would indicate that the recent market decline was basically the 1st leg of 3 probably downward legs, each being successively lower.
Dow Jones Transportation Average: The Dow Jones Transportation Average closed at 4,997.18 I continue to see upside resistance on the the Dow Transportation Average at 5,215.97 and downside support at 4,873.76 and then at 4,795.28. Current Expectations: I think the Dow Transports are going to track sideways between support and resistance for the foreseeable future.
S&P 500 ‘SPX’: The S&P 500 closed yesterday at 1,391.03 I currently see upside resistance on the S&P 500 at 1,405.82 and downside support on the S&P 500 at 1,343.36 and then at 1,334.76 Current Expectations: I think the S&P 500 is going to move lower and test 1,343.36 and then 1,334.76 on a closing basis.
NASDAQ 100 Index ‘NDX’: The NDX closed yesterday at 2,600.48 I see upside resistance on the NDX currently at 2,623.33 and downside support at 2,458.83 on a closing basis. Current Expectations: I think the NDX is going to continue to move lower and test 2,458.83 on a closing basis.
The Bottom Line: I think the market will continue to move lower for the next few trading sessions.
