Sterling Market Commentary for Thursday November 15th, 2012
A Look at Wednesday’s Market: The overall market sold off very sharply yesterday in a broad based move that saw every sector of the market that I track move lower as well. It is pretty clear that the market has entered correction territory and the breaking of key technical support levels indicates that any substantive rally is not likely to occur any time soon. Of note from Wednesday’s trading, the KBW Bank Index ‘BKX’ broke below its 200 day moving average; the Amex Computer Technology Index ‘XCI’ broke through support; the S&P 500 ‘SPX’ broke below its 200 day moving average; and the M.S. Consumer Index ‘CMR’ broke below its 200 day moving average. These are all very negative signals for key portions of the U.S. Economy.
In the Commodities markets, Oil was higher by $0.94 to $86.32 per barrel, and Gold was higher by $5.30 to $1,730.10 per ounce. In the grain markets, Wheat was lower by $0.022 to $8.486 per bushel, and Corn was higher by $0.022 as well to $7.256 per bushel, while Soybeans were higher by $0.110 t0 $14.19 per bushel.
A Few Thoughts on Thursday’s Market: I think the market in general has reached oversold territory, and we could see a slight bounce. However as I have been saying in the last several editions of the Sterling Market Commentary I am expecting the market to either enter into a new sideways trading range at these lower levels or worse yet continue to move lower. As I have been stating since last Friday’s edition of the Sterling Market Commentary, I am expecting the Dow Jones Industrial Average to enter into a new expected short term trading range between 12,715.93 and and 12,118.57 on the lower end. However in the last Thursday’s edition of the Sterling Market Commentary, I stated that I thought we would see a new bear market develop.
With respects to today’s market, I am expecting the overall market to move lower again today. I think there is a realization that the fiscal cliff is not going to be resolved in a manner that will be favorable to businesses and investors that fund job creation. Additionally I believe that the public is beginning to realize that the Fed’s Quantitative Easing programs have lost their effectiveness’; and many people believe that the Fed’s Quantitative Easing programs are actually a big part of the problem. This is forcing a combination of the examination of the valuation models of the U.S. stock market and moves designed to compensate for a rising tax environment in 2013; the net effect is that it is driving valuations and the market lower.
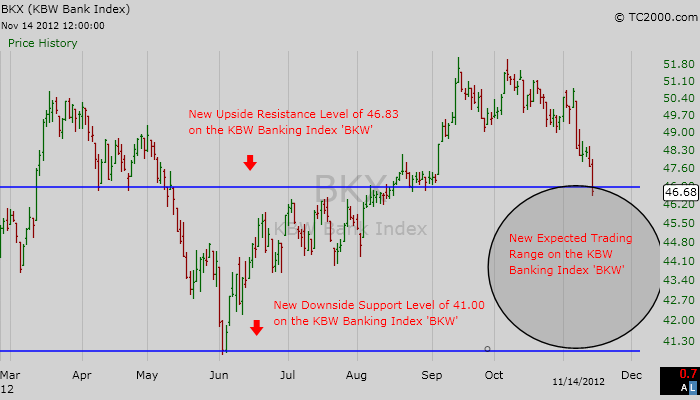
As I mentioned above, the KBW Bank Index ‘BKX’ broke below its 200 day moving average yesterday with its close of 46.68 I have included a chart of the ‘BKX’ below for your review. I now see downside support on the ‘BKX’ at 41.00 and upside resistance at 46.83 This is obviously a very negative chart pattern, and I think it is worth discussing what it may mean for the U.S. economy. The ‘KBX’ Bank Index ‘BKX’ is designed to reflect the performance of the banking industry, which is a significant portion of the U.S. economy and plays a very important function in financing the workings of the U.S. economy. Poor performance of the U.S. Banking sector is not going to be a good thing for the U.S. Economy. Based upon the chart below, I think the KBW Bank Index ‘BKX’ is going to test the lower end of its trading range at 41.00 on a closing basis.

The Dow Jones Industrial Average: The Dow Jones Industrial Average closed at 12,570.95 With yesterday’s sharp sell off I have lowered my upside resistance level on the Dow Jones Industrial Average at 12,715.93 on a closing basis. I now see downside support coming in at 12,118.57 on a closing basis. Current Expectations: I think we are starting a new trend lower in the Dow. I am expecting the Dow Jones Industrial Average to continue to move lower and test 12,118.57 on a closing basis.
Dow Jones Transportation Average: The Dow Jones Transportation Average closed at 4,925.95 I continue to see upside resistance on the the Dow Transportation Average at 5,215.97 and downside support at 4,873.76 and then at 4,795.28. Current Expectations: I think the Dow Transports are going to track sideways between support and resistance for the foreseeable future.
S&P 500 ‘SPX’: The S&P 500 closed yesterday at 1,355.49 I currently see upside resistance on the S&P 500 at 1,358.59 and downside support on the S&P 500 at 1,343.36 and then at 1,334.76 Current Expectations: I think the S&P 500 is going to move lower and test 1,343.36 and then 1,334.76 on a closing basis.
NASDAQ 100 Index ‘NDX’: The NDX closed yesterday at 2,531.87 I see upside resistance on the NDX currently at 2,623.33 and downside support at 2,458.83 on a closing basis. Current Expectations: I think the NDX is going to continue to move lower and test 2,458.83 on a closing basis.
The Bottom Line: I think the market will continue to move lower for the next few trading sessions.
