Sterling Market Commentary for Friday October 26th, 2012
A Look at Thursday’s Market: The overall market finished Thursday slightly higher after an early morning rally faded and the Dow Jones Industrial Average traded around the break even mark for most of the day. Overall, the majority of the indices I track finished the day higher. The strongest sectors were Gold/Silver, Broker/Dealer, Natural Gas, Transports, Oil & Gas, Banking, Commodities, Healthcare related, and Consumer sectors. There was weakness in the Airlines , Retailers, Chemicals, Telecoms, and Cyclicals. The High Tech sectors were mixed; and there was weakness in bonds as interest rates moved higher on the day. In the commodities markets, Oil was higher by $0.32 to $86.05 per barrel, and Gold was higher by $11.40 to $1,713.00 per ounce. In the grain markets, Wheat was lower by $0.112 to $8.726 per bushel, and Corn was lower by $0.124 to $7.420 per bushel, while Soybeans were lower by $0.064 to $15.640 per bushel.
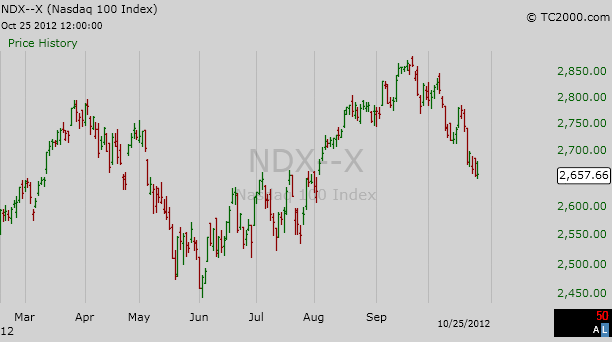
A Few Thoughts on Friday’s Market: In looking at the charts from yesterday’s market it is clear that the overall market is in the process of moving lower. However there are still a few sectors that have not yet started to participate in the current move lower. However, barring a major upside surprise in the 3rd quarter advance GDP numbers this morning, we are looking at a sharply lower open today due to the disappointing earnings results from Apple, Inc. ‘AAPL’ and Amazon.com, Inc. ‘AMZN’. My thoughts are that this will result in turning lower the charts of those indices that have held up the best so far during this market pullback. If this happens we could see a full fledged move lower by the entire market. It should also be noted that there is a good chance that another move lower today will cause the NASDAQ 100 ‘NDX’ to break its 200 day moving average. If that happens, I see it as a sign that the market will not be returning to its earlier highs any time soon. I have inserted a chart of the NASDAQ 100 below for your review.

The Dow Jones Industrial Average: The Dow Jones Industrial Average closed at 13,077.95 With the recent downturn in the Dow Jones Industrial Average I am now lowering my upside resistance level on the Dow Jones Industrial Average at 13,275.20 on a closing basis. I now see downside support coming in at 13,000.71 and then at 12,943.82 on a closing basis. I should point out that the support level at the 12,943.82 level is basically a “double bottom” on the charts and breaking through this level would be significant. Current Expectations: I think we are starting a new trend lower in the Dow. I am expecting the Dow Jones Industrial Average to continue to move lower and test 13,000.71 and then 12,943.82 on a closing basis.
Dow Jones Transportation Average: The Dow Jones Transportation Average closed at 5,004.53 I see upside resistance on the the Dow Transportation Average at 5,215.97 and downside support at 4,873.76 and then at 4,795.28. Current Expectations: I think the Dow Transports are going to track sideways between support and resistance for the foreseeable future.
NASDAQ 100 Index ‘NDX’: The NDX closed yesterday at 2,657.66 I see upside resistance on the NDX currently at 2,719.21 and downside support at 2,647.47 and then at 2,623.33 on a closing basis. Current Expectations: I think the NDX is going to continue to move lower and test 2,647.47 and then 2,623.33 on a closing basis.
The Bottom Line: I think the market will continue to move lower for the next few trading sessions.
