Sterling Market Commentary for Monday October 29th, 2012
A Look at Friday’s Market: The overall market finished Friday mixed, with the Dow Jones Industrial Average and the NASDAQ 100 finishing slightly higher, while the S&P 500 finished the day slightly lower. A majority of the various sector indices I track finished the day lower as well. There was weakness in the Biotech, Banking, Airlines, Gold/Silver, Oil Services, Insurance, Commodities, Consumer, and Cyclical indices. There was strength in the Retailers, Natural Gas, Chemicals, Telecom, Transports, and the Oil & Gas indices. The High Tech indices were mixed.
In the commodities markets, Oil was higher by $0.32 to $86.05 per barrel, and Gold was higher by $11.40 to $1,713.00 per ounce. In the grain markets, Wheat was lower by $0.112 to $8.726 per bushel, and Corn was lower by $0.124 to $7.420 per bushel, while Soybeans were lower by $0.064 to $15.640 per bushel.
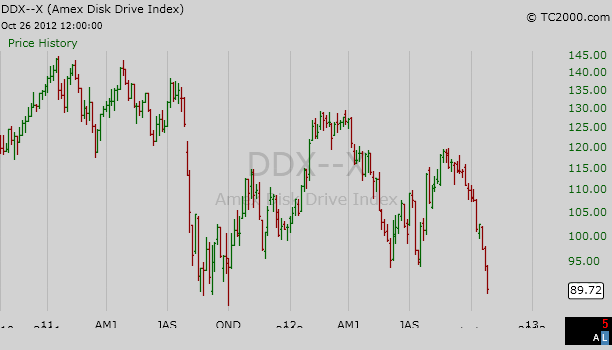
A Few Thoughts on Monday’s Market: In looking at the charts from Friday’s trading activity, it is very clear that most of the chart patterns are bearish and continue to indicate a further pullback in the overall market. Additionally I noticed that the Amex Disk Drive Index ‘DDX’ hit a multi-year closing low on Friday. I’ve inserted a chart on the ‘DDX’ below for your review. I think that their is a good possibility that the ‘DDX’ will continue to move lower test its long term support levels in the mid 40’s range. As for the overall market, we have significant economic data to be released this week, including personal consumption and spending as well as the unemployment rate later this week. I am not looking for any upside surprises in the numbers, and I am expecting surprises to the downside if anything. I think the over all market is going to continue to drift lower throughout the week.

The Dow Jones Industrial Average: The Dow Jones Industrial Average closed at 13,107.21 I see upside resistance level on the Dow Jones Industrial Average at 13,275.20 on a closing basis. I now see downside support coming in at 13,000.71 and then at 12,943.82 on a closing basis. I should point out that the support level at the 12,943.82 level is basically a “double bottom” on the charts and breaking through this level would be significant. Current Expectations: I think we are starting a new trend lower in the Dow. I am expecting the Dow Jones Industrial Average to continue to move lower and test 13,000.71 and then 12,943.82 on a closing basis.
Dow Jones Transportation Average: The Dow Jones Transportation Average closed at 5,052.35 I see upside resistance on the the Dow Transportation Average at 5,215.97 and downside support at 4,873.76 and then at 4,795.28. Current Expectations: I think the Dow Transports are going to track sideways between support and resistance for the foreseeable future.
NASDAQ 100 Index ‘NDX’: The NDX closed yesterday at 2,663.89 I see upside resistance on the NDX currently at 2,719.21 and downside support at 2,647.47 and then at 2,623.33 on a closing basis. Current Expectations: I think the NDX is going to continue to move lower and test 2,647.47 and then 2,623.33 on a closing basis.
The Bottom Line: I think the market will continue to move lower for the next few trading sessions.
