A Look at Friday’s Activity: The overall market finished Friday slightly lower with the Dow Jones Industrial Average lower by approximately 20 points. The broad market was mostly to the downside with a majority of the sector indices I track lower on the day. There was strength in the Utilities, Semiconductors, and the Retailers. The weakest sectors were Banking, Broker/Dealers, Biotech, Insurance, Gold/Silver, Airlines, Commodities, High Tech, Natural Gas, Oil Services, and Transports.
Oil was higher by $0.39 to $82.98 per barrel, and Gold was lower by $17.40 to $1,635.80 per ounce. In the Grain markets, Wheat was lower by $0.084 to $6.074 per bushel, and Corn was lower by $0.054 to $6.00 per bushel, while Soybeans were lower by $0.054 to $11.582 per bushel.
A Few Thoughts Before the Open: In looking at the charts from Friday’s activity I have the following thoughts.
1. The pre-market futures are sharply higher this morning due to the news out of Europe that Germany and France have pledged to come to a solution for the European debt crisis within the next 2 weeks. This makes me nervous. They have not actually agreed upon a solution. Additionally deadlines to come to agreement typically produce bad agreements in my opinion. I have said it before, and I’ll say it again; Europe has deep structural problems with its entitlement system that are generational in nature and will take years, if not decades to fix, if at all.
2. In looking at the charts of the various sector indices I track, there just doesn’t seem to be any that are really signaling a rally has started. Perhaps that will change following today’s activity.
3. The vast majority of the stocks I looked at still appear to be tracking sideways. The only real improvement is that the number of stocks that have bullish patterns is about equal to those with bearish pattern; but the overall number of both is still a very small number.
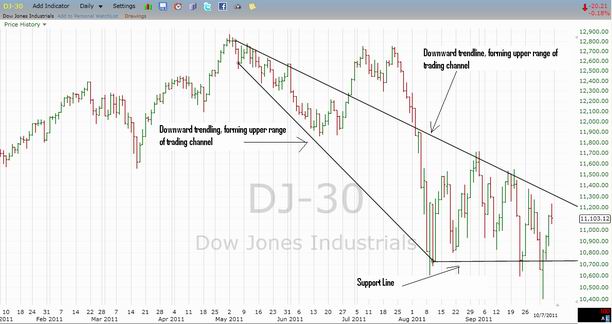
4. In looking at a chart of the Dow Jones Industrial Average, which I have inserted below, I see a pair of downward trendline intersecting with a support line at the 10,700 level. The chart shows that the Dow Jones Industrial Average has been tracking sideways since early August and in doing so has been working itself into a tighter trading range. In my opinion this forms what I call a “triangle pattern” with a highly predictable outcome. There is a high degree or probability as the downward trendline that is forming the upper range of the trading channel gets closer to the downward support line the overall market will make a big move to either the upside or the downside. Experience has taught me that we will most likely see this occur within the 1st couple of weeks of November. I do not honestly whether the breakout will be to the upside or the downside, my gut is telling me that there is a good chance it could be to the downside; but only time will tell and perhaps things will clarify themselves in the next couple of weeks.

I hope to get a chance to update our support and resistance level on the various indices I track in tomorrow morning’s blog.
