Sterling Market Commentary for September 19th, 2011

A Look at Friday’s Activity:  The overall market moved moderately higher on Friday in a relatively broad based move that saw the majority of the sector indices I track move higher as well.  The was strength the Retailers, Utilities,  Gold/Silver, High Tech, Insurance, Chemicals, Healthcare related, Broker/Dealers, Consumer, Commodities, Cyclicals, Airlines, and Telecom indices.  There was weakness in the Networking, Oil Services, Biotech, Banking, Transports, Oil & Gas, and Natural Gas indices.

Oil was lower by $1.41 to $88.18 per barrel, and Gold was higher by $33.30 to $1,812.50 per ounce.  Wheat was lower by $0.076 to $6.882 per bushel, Corn was lower by $0.09 to $6.92 per bushel, and soybeans were lower by $0.032 to $13.53 per bushel.

A Few Thoughts Before the Open: In looking at the charts from Friday’s activity the extreme vast majority of the charts were to the upside. However very few had broken above upside resistance levels.  The individual stocks within the overall market currently have an extremely correlation with the movement of the major market indices.  I feel this a result of the increased use of exchange traded funds (ETFs) and  computer driven trading;  basically I think all the programers went to the same school and are following the same playbook.  However this creates a problem on days like today.  when the futures are sharply different from Friday’s close.  In cases such as today there are an extremely few number of charts that moved counter to Friday’s move, and as a result there are very few trading opportunities for trading today.  I feel this is ultimately detrimental to building a diversified portfolio.

I don’t really have a solution for the problem of this extremely high correlation between individual stocks and the major market indices. I think in the short term it is here to stay.  I think it will subside over the longer term if the global financial situation calms down and if we see a reduction in the number of computer driven trading strategies.  Until then we need to learn to live with it.

Following the strong move upwards in the later half of last week,  I thought now would be a good time to update our support and resistance levels on the various indices I track.

In looking at the various indices I track, I have the following comments.

Dow Jones Industrial Average:  The Dow Jones Industrials closed at 11,509.09    I currently see upside resistance on the Dow at 11,613.53 and downside support at 10,719.94 on a closing basis.  I think the Dow Jones Industrial Average is in a sideways trading pattern with the upper end at 11,613.53 and the lower end at 10,719.94 Until the Dow closes above or below this range I think it is basically tracking sideways.

S&P 500 ‘SPX’:  The S&P 500 closed at 1,216.01  I see upside resistance on the S&P 500 at 1,218.89 and downside support at 1,127.79 on a closing basis.

NASDAQ 100 Index ‘NDX’:  The NASDAQ 100 closed at 2,306.09  I see upside resistance on the NDX at 2,325.06 and downside support at 2,192.96

The Dow Jones Transportation Average:  The Dow Transports closed at 4,664.60  I see upside resistance on the Dow Transports at 4,683.96 and downside support level  at 4,320.05 on a closing basis.

M.S. Commodities Related Equity Index ‘CRX’:  The ‘CRX’ closed at 893.66.  I see upside resistance on the ‘CRX’ at 924.89 and downside support at 847.10

KBW Banking Index ‘BKW:  The ‘BKW’ closed at 38.69.  I see upside resistance on the ‘BKW’ at 41.42 and downside support at approximately 35.10 on a closing basis.

S&P Banking Index ‘BIX’:  The ‘BIX’ closed 118.86.  I see upside resistance on the ‘BIX’ at 120.71 and downside support at 100.96 on a closing basis.

Amex Broker/Dealer Index ‘XBD’:  The ‘XBD’ closed at 89.42   I see upside resistance at 92.97 and downside support at 80.87 on a closing basis. I am expecting the ‘XBD” to continue to move lower and test 80.87  on a closing basis.

S&P Insurance Index ‘IUX’:  The ‘IUX’ closed at 161.55  I see upside resistance on the ‘IUX’ at 175.13 and downside support at 143.80 on a closing basis.  I am currently expecting the ‘IUX’ to continue to move lower and test 143.80 on a closing basis.

Amex Gold & Silver Index:  The Amex Gold & Silver Index ‘XAU’ closed at 217.56  I see upside resistance on the ‘XAU’ at 228.95 and downside support at 208.47 I have been looking at increasing volatility this index and as a result have widened my trading range by adjusting the downside support level down to 208.47.  As a result I basically see this index tracking sideways between 228.95 on the upper end and 208.47 on the lower end.

Amex Oil & Gas Index:  The Amex Oil & Gas Index closed at 1,148.83  I currently see upside resistance on the ‘XOI’ at 1,169.65 on a closing basis and downside support at 1,050.78.  The ‘XOI’ appears to be in a sideways trading pattern.  I have widened our trading band to 1,151.76 on the high end and 1,050.78 on the lower end.

M.S. Cyclicals Index:  The M.S. Cyclicals Index ‘CYC’ closed yesterday at 867.29  I currently see upside resistance on the ‘CYC’ at 868.97 and downside support at 789.46  on a closing basis.

M.S. Consumer Index:  The M.S. Consumer Index ‘CMR’ closed at 719.66  I currently see upside resistance on the ‘CMR’ at 725.78. and downside support at 691.44 on a closing basis.

www.sterlinginvestments.com


Sterling Market Commentary for September 15th, 2011

A Few Thoughts Before the Open:  The overall market staged a strong rally yesterday that saw the broad market move in lockstep with the major market indices. The Dow Jones Industrial Average rose 186 points to close at 11,433.18  This took the Dow Jones Industrial Average to the upper end of its trading range.  However despite the nearly 500 point move higher by the Dow it is still below its 40 day moving average and has not broken through upside resistance which I see being at 11,493.57 on a closing basis.  Until the Dow Jones Industrial Average closes above 11,493.57 (which it could do today),  I still consider the Dow to be in a sideways trading pattern with the upper end at 11,493.57 and the lower end at 10,719.94

Considering yesterday’s strong move to the upside I thought now would be a good time to update our expectations for the various sector indices we track, which I have done so below.  Despite yesterday’s move higher, I really did not see anything that broke out to the upside. The Bottom Line:  Unless we see some follow through today, we still look to be in a sideways trading pattern.

In looking at the various indices I track, I have the following comments.

Dow Jones Industrial Average:  The Dow Jones Industrials closed at 11,433.18    I currently see upside resistance on the Dow at 11,493.57 and downside support at 10,719.94 on a closing basis.  I think the Dow Jones Industrial Average is in a sideways trading pattern with the upper end at 11,433.18 and the lower end at 10,719.94 Until the Dow closes above or below this range I think it is basically tracking sideways.

S&P 500 ‘SPX’:  The S&P 500 closed at 1,209.11  I see upside resistance on the S&P 500 at 1,218.89 and downside support at 1,127.79 on a closing basis.

NASDAQ 100 Index ‘NDX’:  The NASDAQ 100 closed at 2,286.56  I continue to see downside support on the NDX at 2,100  and  upside resistance at 2,292.34.

The Dow Jones Transportation Average:  The Dow Transports closed at 4,664.84  I see upside resistance on the Dow Transports at 4,683.96 and downside support level  at 4,320.05 on a closing basis.

M.S. Commodities Related Equity Index ‘CRX’:  The ‘CRX’ closed at 892.32.  I see upside resistance on the ‘CRX’ at 924.89 and downside support at 847.10

KBW Banking Index ‘BKW:  The ‘BKW’ closed at 38.85.  I see upside resistance on the ‘BKW’ at 41.42 and downside support at approximately 35.10 on a closing basis.

S&P Banking Index ‘BIX’:  The ‘BIX’ closed 119.39.  I see upside resistance on the ‘BIX’ at 120.71 and downside support at 100.96 on a closing basis.

Amex Broker/Dealer Index ‘XBD’:  The ‘XBD’ closed at 89.14   I see upside resistance at 92.97 and downside support at 80.87 on a closing basis. I am expecting the ‘XBD” to continue to move lower and test 80.87  on a closing basis.

S&P Insurance Index ‘IUX’:  The ‘IUX’ closed at 160.23  I see upside resistance on the ‘IUX’ at 175.13 and downside support at 143.80 on a closing basis.  I am currently expecting the ‘IUX’ to continue to move lower and test 143.80 on a closing basis.

Amex Gold & Silver Index:  The Amex Gold & Silver Index ‘XAU’ closed at 215.18  I see upside resistance on the ‘XAU’ at 228.95 and downside support at 208.47 I have been looking at increasing volatility this index and as a result have widened my trading range by adjusting the downside support level down to 208.47.  As a result I basically see this index tracking sideways between 228.95 on the upper end and 208.47 on the lower end.

Amex Oil & Gas Index:  The Amex Oil & Gas Index closed at 1,151.76  I currently see upside resistance on the ‘XOI’ at 1,1469.65 on a closing basis and downside support at 1,050.78.  The ‘XOI’ appears to be in a sideways trading pattern.  I have widened our trading band to 1,151.76 on the high end and 1,050.78 on the lower end.

M.S. Cyclicals Index:  The M.S. Cyclicals Index ‘CYC’ closed yesterday at 865.95  I currently see upside resistance on the ‘CYC’ at 868.97 and downside support at 789.46  on a closing basis.

M.S. Consumer Index:  The M.S. Consumer Index ‘CMR’ closed at 718.12  I currently see upside resistance on the ‘CMR’ at 725.78. and downside support at 691.44 on a closing basis.

www.sterlinginvestments.com

Market Commentary for September 15th, 2011

A Look at Wednesday’s Activity:

The overall market staged a strong rally during the afternoon before profit taking in the last half hour of trading trimmed some of the gains.  However,  the overall market still put in a strong move higher in a broad based  move that saw every index I track move higher with the exception of the Gold indices.  The best performers on the day were the High Tech, Transports,  Airlines, Financials, Cyclicals, Retailers, and Energy indices.

It looks like a big factor in the markets move higher was comments by Secretary Geithner that the Europeans would not let their banks fail.  Unfortunately,  I think the voters in Europe may not be thinking the same.

In looking at the Dow Jones Industrial Average despite 3 days of moves higher it should be noted that the Dow Jones Industrial Average has basically only managed to rally to its 9-day moving average.  In other words the market has basically returned from a deeply oversold condition;  nothing to get excited about at this point.  A couple of additional days of follow through would be nice.  However,  unless the market is able to put together another couple of days of upward movement, then my concern is that when the market moves back lower it could push past the recent short term lows.

A Few Thoughts Before the Open:

In looking at the charts from yesterday’s trading activity I noticed that several of the indices I track have moved above their 9-day moving average. If we see continued follow through with a move higher today,  then we could see the makings of a legitimate rally to higher levels.

I have an early morning meeting, so I am going to cut short today’s blog.  However, before I go, a quick note that jobless claims are out today at 8:30am and they could easily influence the direction of the market.

www.sterlinginvestments.com

Sterling Market Commentary for September 14th, 2011

A Look at Tuesday’s Trading Activity:

The overall market moved moderately higher in a relatively broad based move that saw all the sector indices I track move higher as well.  The strongest sectors were the Airlines,  Transports, High Tech, Broker/Dealers, Cyclicals, Chemicals, and Banking indices.

A Few Thoughts Before the Open:

In looking at the charts of yesterday’s trading activities for the various indices I track I did not see anything that really stood out as noticeable.  The vast majority of indices I looked at still have negative chart patterns. In looking at the individual stock charts almost nothing has broken from what I would call a sideways trading pattern.

The Bottom Line:  I am looking for the market to continue with its sideways trading pattern.

www.sterlinginvestments.com


Sterling Market Commentary for September 13th, 2011

A Look at Monday’s Activity:

The overall market staged a late rally with the Dow Jones Industrial Average moving almost 200 points higher in the final 45 minutes of trading on the day.  This was an impressive rally that saw almost every sector index I track move higher on the day.  The strongest sectors were the Semiconductors,  Banking,  High Tech,  Retailers,  Oil Services,  Insurance,  Broker/Dealers,  Healthcare related, and Consumer indices.  There was weakness in the Gold/Silver,  Commodities,  Chemicals,  Pharmaceuticals, Cyclicals, and Transports.

A Few Thoughts Before the Open:

In looking at the charts from yesterday’s trading activity I have the following thoughts and comments.

1.  The 1st being that high tech indices were obviously the strongest performers on the day.  I believe this is primarily a result of Broadcom’s acquisition of NetLogic for $3.7 billion.

2.  Despite the strong move back higher at the end of the day, the vast majority of the indices I looked at simply recovered from a deeply oversold position.  However it still left the majority of them with negative chart patterns. I saw nothing to indicate a market rally would start anytime soon.

3.  The healthcare related indices all look to be under pressure. I think this is a result of the recent appeals court ruling regarding Obamacare.  Once again,  regulations matter.

4.  The gold indices moved south in way that raises some concerns. If we get some follow through today,  we could see the start of a pullback in gold.

It looks like I missed the inclusion of the economics news calendar from the Sterling Weekly yesterday.  As a result, I have included  it in today’s blog:

Sterling Calendars for the Week of September 12th, 2011

Date Est.
Time
Release For Consensus Prior
09/13 8:30am Export Prices – Ex. Ag. Aug. N/A 0.5%
09/13 8:30am Import Prices – Ex. Oil Aug. N/A 0.4%
09/13 2:00pm Treasury Budget Aug. ($132.0B) ($90.5B)
09/14 7:00am MBA Mortgage Index 09//10 N/A (4.9%)
09/14 8:30am Producer Price Index (PPI) Aug. (0.1%) 0.2%
09/14 8:30am Core Producer Price Index (Core PPI) Aug. 0.2% 0.4%
09/14 8:30am Retail Sales Aug. (0.5%) 0.5%
09/14 8:30am Retail Sales Ex – Auto Aug. (0.2%) 0.5%
09/14 10:00am Business Inventories Jul. 0.4% 0.3%
09/14 10:30am Crude Inventories 09/10 N/A (3.963K)
09/15 8:30am Initial Claims 09/10 410K 414K
09/15 8:30am Continuing Claims 09/03 3,700K 3,717K
09/15 8:30am Core Consumer Price Index (Core CPI) Aug. 0.2% 0.2%
09/15 8:30am Consumer Price Index (CPI) Aug. 0.2% 0.5%
09/15 8:30am Empire Manufacturing Sep. (5.0) (7.7)
09/15 8:30am Current Account Balance Q2 ($121.0B) ($119.3B)
09/15 9:15am Industrial Production Aug. (0.2%) 0.9%
09/15 9:15am Capacity Utilization Aug. 77.0% 77.5%
09/15 10:00am Philadelphia Fed. Sep. (15.0) (30.7)
09/16 9:00am Net Long-Term TIC Flows Jul. N/A $3.7B
09/16 9:55am Michigan Sentiment Sep. 53.0 55.7

Sterling Weekly for the Week of September 12th, 2011

A Look at the Dow Jones Industrial Average

Since the previous edition of the Sterling Weekly the Dow Jones Industrial Average declined 248.13 points or approximately 2.2% to 10,992.13 The overall market sold off sharply late last week and looks to be starting this week off with another large move to the downside. The selling right now is being attributed to the European sovereign debt crisis. This is a very legitimate cause of market concern, but in my opinion it is not the sole reason for our market downturn. The other major issue effecting the market that is not currently getting as much attention as it deserves is the slowing economic growth rate.

This week has a heavy economics calendar with several key announcements being released starting with whole sale inflation in the form of the Producer Price Index (PPI) and Retail Sales on Wednesday, and inflation at the consumer level in the form of the Consumer Price Index (CPI) and jobs data on Thursday. Additionally Industrial Production and Capacity Utilization are to be released on Thursday as well. I feel that these various releases are going to give us a fairly decent look at where the U.S. economy is headed. If you notice, the expectations for most of these release is showing a continuing decline in economic activity. This is clearly indicating expectations of an economic slowdown; and if that is the case then we are probably looking at the U.S. economy slipping back into a recession later this year or sometime in early 2012.

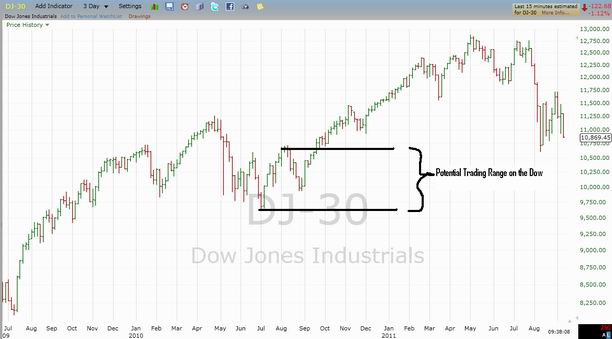
If I am correct, and the U.S. economy slips back into recession, then I am expecting the Dow Jones Industrial Average to continue to move lower reflecting the declining U.S. economic output. I currently see downside support on the Dow Jones Industrial Average at the upper and lower end of the trading range established last summer following the Flash Crash of 2010. I see the upper end of this range at 10,605.50 and the lower end at 9,686.48.

Dow Jones Industrial Average for September 9th, 2011

Disclaimer:
The Sterling Investments series of newsletters is produced by Sterling Investment Services, Inc. All information used in the production has been obtained from sources believed to be reliable and accurate. Sterling Investment Services does not warrant or assume any liability for inaccuracy of the information used to produce our publications. To receive further information on these services please visit our web page at: www.sterlinginvestments.com If you would like to contact us our fax # is (404)-816-8830 Email address is: enelson@sterlinginvestments.com Sterling Investment Services may hold positions in the securities recommended or may be providing consulting services to the companies mentioned within this report.