
Since the previous edition of the Sterling Weekly the Dow Jones Industrial Average rose 181.72 points or approximately 1.4%% to 12,982.95 The overall market has continued to move higher and the talk in the financial press has focused on the Dow Jones Industrial Average approaching the 13,000 level. While this is a very big psychological level, I do not see if having any value from a technical or chart basis. While everyone has focused on the Dow Jones Industrial Average, the price of Oil has risen almost 10% in the month of February. This is not a good thing like the rising level of the Dow Jones Industrial Average is.
Crude oil closed at $109.77 on Friday, and I thought it was time to take a close look at the price of oil and see where it may be headed. I’ve inserted a chart of the price of oil below showing its peak in 2008 and subsequent decline.
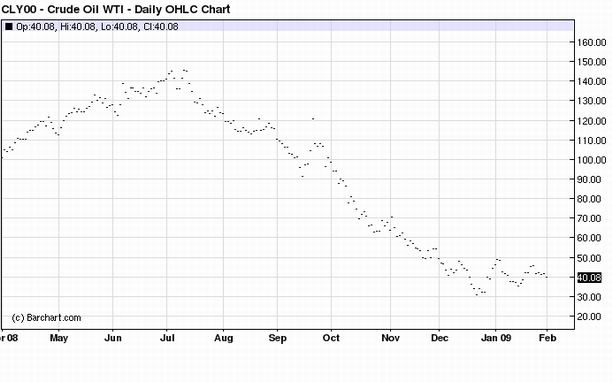
The price of oil reached a closing high of $145.66 on July 11th, 2008 and following the start of the 2008 financial crisis declined to a closing low of $30.81 on December 22nd, 2008. I’ve inserted a chart of the price of oil over the last 12 months below.
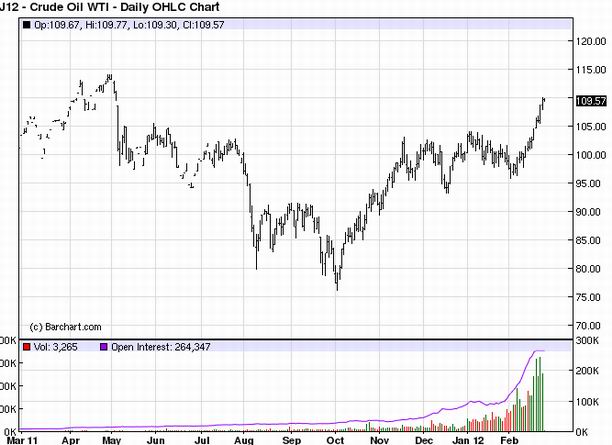
The price of oil reached a short term high of $113.92 per barrel on April 29th, 2011, and then declined to $76.78 on October 4th, 2011. What is very important about this chart is that if the price of oil closed above $113.92 per barrel, then it will have completed a “cup pattern” with a measured move to $151.06 per barrel. I consider cup patterns to be very highly reliable, and very predictable. On Friday the price of wholesale gasoline closed at $3.15 per gallon. This is a ratio of just under 35 to 1 between the price of oil and gasoline. Applying that ratio to $150 per barrel oil and you get an estimated wholesale gasoline of approximately $4.28 per gallon. That would most likely put the price at the pump close to $5.00 per gallon. That is going to cause some very real pain for consumers and the US economy.
If that doesn’t scare you enough, if the price of oil closes above $145.66 per barrel, then it will have completed a much larger cup pattern that dates back to the summer of 2008 with a measured move to $260.51 per barrel. OUCH!!!! If $150 per barrel oil is a problem for the US economy, then this is going to be an outright disaster. If the current ratio between the price of oil and gasoline remains in place, then we are looking at the wholesale price of gasoline reaching approximately $7.50 per gallon! This would probably put the price at the pump well above $8.00 per gallon. I think at that price level, big portions of the US and world economies would shut down.
Do I think this could happen? Unfortunately yes! I have found cup patterns to be among the most tradable of chart patterns. If oil closes above $113.92 per barrel, then I think we could see a move to $150 per barrel in 6 months or less. Not only is that going to cause real pain for consumers, but it will put a real damper on the US economy, as well as the world economy. There is a very real danger that the price of oil at that level will ignite inflation in this country and on a world wide basis. If inflation really takes off, just imagine what that will do to the efforts to resolve the European debt crisis! How long would it take for the price of oil to reach $260 per barrel? My best guess is that it would take anywhere from 3-5 years. However, a nuke going off in the Mid-East could send it there over night. Either way, it would be a real disaster for everyone. If we see anything close to $150 per barrel or higher, then one more thing I am relatively certain of is that we will not see the Dow Jones Industrial Average anywhere close to new highs.
In case you are wondering about our track record of commenting on the price of Oil; our past comments can be found on our Amex Oil & Gas Index ‘XOI’ page. We don’t comment often, but when we have commented, we haven’t been wrong yet.
This week does see some important economic releases this week with GDP numbers on Wednesday, and Consumer Confidence on Tuesday. The GDP number, as always, has the potential to move the market in a significant way.
| Sterling Calendars for the Week of February 27th, 2012 |
| Economic Calendar |
| Date | Est. Time |
Release | For | Consensus | Prior |
| 02/27 | 10:00am | Existing Home Sales | Jan. | 1.0% | (1.9%) |
| 02/28 | 8:30am | Durable Goods Orders | Jan. | (1.4%) | 3.0% |
| 02/28 | 8:30am | Durable Goods – Ex Transportation | Jan. | 0.2% | 2.2% |
| 02/28 | 9:00am | Cas-Shiller 20 City Index | Dec. | (3.6%) | (3.7%) |
| 02/28 | 10:00am | Consumer Confidence Index | Feb. | 62.5 | 61.1 |
| 02/29 | 7:00am | MBA Mortgage Index | 02/25 | N/A | (4.5%) |
| 02/29 | 8:30am | GDP – Second Estimate | Q4 | 2.8% | 2.8% |
| 02/29 | 8:30am | GDP Deflator – Second. Est. | Q4 | 0.4% | 0.4% |
| 02/29 | 9:45am | Chicago PMI | Feb. | 60.0 | 60.2 |
| 02/29 | 10:30am | Crude Inventories | 02/25 | N/A | 1.633M |
| 02/29 | 2:00pm | Fed’s Beige Book | Feb. | ||
| 03/01 | 8:30am | Initial Claims | 02/25 | 355K | 351K |
| 03/01 | 8:30am | Continuing Claims | 02/18 | 3,425K | 3,392K |
| 03/01 | 8:30am | Personal Income | Jan. | 0.4% | 0.5% |
| 03/01 | 8:30am | Personal Spending | Jan. | 0.3% | 0.0% |
| 03/01 | 8:30am | PCE Prices – Core | Jan. | 0.2% | 0.2% |
| 03/01 | 10:00am | ISM Index | Feb. | 54.5 | 54.1 |
| 03/01 | 10:00am | Construction Spending | Jan. | 1.0% | 1.5% |
| 03/01 | 2:00pm | Auto Sales | Feb. | N/A | 5.0M |
| 03/01 | 2:00pm | Truck Sales | Feb. | N/A | 5.73M |