A Look at Tuesday’s Market Activity: The overall market was mixed with the Dow Jones Industrial Average slightly higher while the NASDAQ 100 and the S&P 500 were lower. The majority of the various sector indices I track were lower as well. The weakest sectors were High Tech, Transports, Cyclicals, Retailers, Oil Services, Chemicals, Telecom, Oil & Gas, Airlines, Natural Gas, and Insurance indices. There was strength in the Gold/Silver, Banking, Healthcare Related, and Consumer indices. bby
Oil was higher by $1.11 to $86.92 per barrel, and Gold was higher by $30.20 to $1,806.90 per ounce. Wheat was higher by $0.016 to $6.746 per bushel, Corn was lower by $0.020 to $6.902, and Soybeans were higher by $0.020 to $13.38 per bushel.
A Few Thoughts Before the Open: In Looking at the charts from yesterday’s trading activity I have the following thoughts.
1. Despite yesterday’s relatively flat close by the major market indices, several of the various sector indices looked to be turning back to negative territory. My thoughts are that this could be a sign of things to come over the course of the next few trading days.
2. In looking at the charts of the stocks with the heaviest trading volume, the vast majority that appeared to be breaking out from their sideways trading patterns, broke to the downside, not the upside. This is usually the sign of a market downturn not a rally.
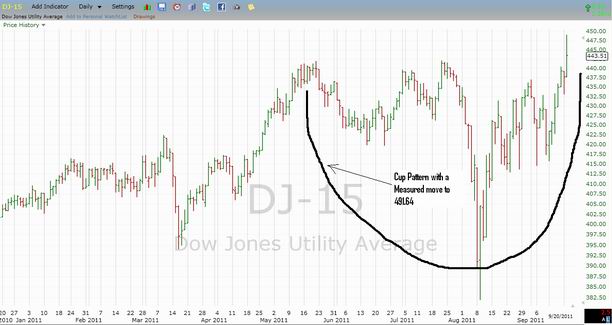
3. The utility stocks have been the best performing sector over the course of the last several days. In fact the Dow Jones Utility Average set a new yearly closing high yesterday. I think this is primarily the result of two factors. The 1st being yield hungry investors are looking for alternatives to the ultra-low bond yields. The 2nd being, the EPA recently announced it would not be implementing new regulations that would have had a very negative impact on the utility industry.
In looking at a chart of the Dow Jones Utility Average, which I have included below, it looks as if the Dow Jones Utility Average has completed a “cup pattern” with a measured move to 491.64 On a longer term basis, I think there is a possibility that if the Dow Jones Utility Average closes above the 491.64 level, then it could continue to move higher and test 550.66, which is a point of upside resistance established on December 7th, 2007.

